By
Michael Matusik has over 30 years’ experience in property research and project advice. He outlines how a useful tool called the property clock shows what’s happening in the market.
The property clock is an often-used yet simple tool that displays where select markets are positioned in the housing cycle. I have been using my version of the property clock for close to three decades and have found it’s an effective way to display the comparative heat in the housing market. Most people can understand the clock, and it’s a tool worth incorporating in a discussion about the housing market.
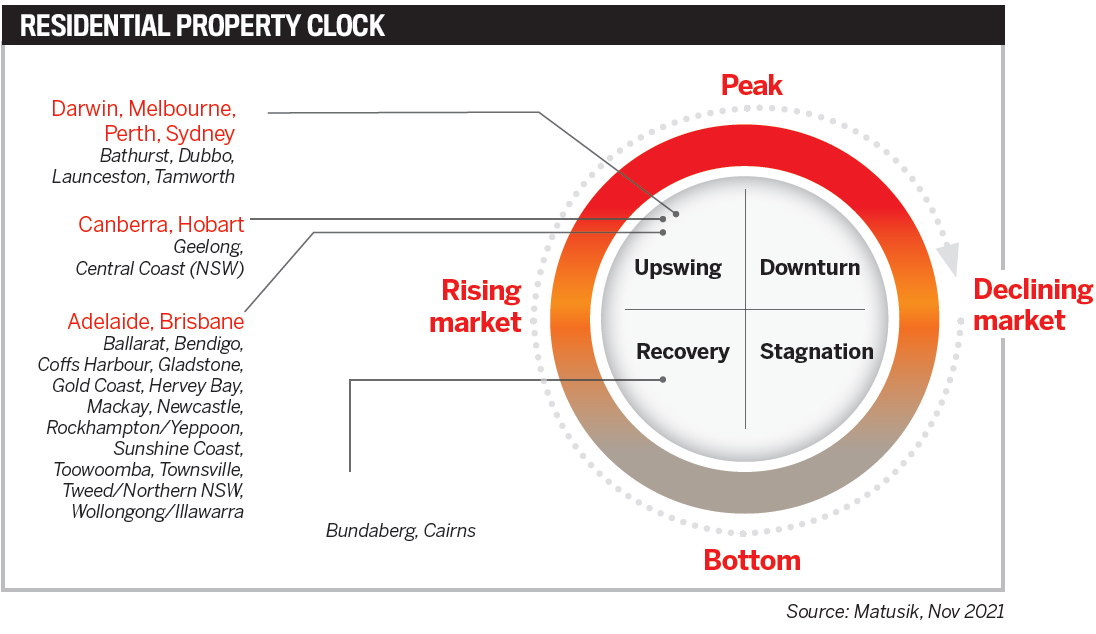
There are four phases in the housing cycle: recovery, upswing, downturn and stagnation. The market is rising between the recovery and upswing phases; it peaks between upswing and downturn, declines between downturn and stagnation, and once it hits bottom it starts again.
It is often best to think of the four phases of the housing cycle as seasons: recovery is spring, upswing is summer, downturn is autumn, and stagnation is winter. The temperatures relate to the housing market’s relative heat.
But unlike the seasons, housing cycle phases are not equidistant in terms of time. Typically, an upswing and downturn are shorter than a recovery and stagnation.
Also, when a market significantly overheats, or is substantially oversupplied, during the upswing phase, then the following downturn can be sharp and the stagnation long. Sometimes a market will miss a cycle – which history suggests typically takes between seven and eight years between peaks – as a result of the previous exuberance.
The market positions depend on the ‘balance between supply and demand’, with demand exceeding supply during the recovery and upswing phases and the reverse happening during a downturn. Throughout stagnation the market is often more equally balanced between properties listed for sale and buyers.
It’s also rare to see the housing market as congested around the upswing and recovery phases as shown in my current property clock. The last time the detached housing markets were similarly positioned was between 1987 and 1989. And while economic conditions and policy responses were different in the late 1980s, there was very little price growth for a long time once the overheated market peaked in 1989.
Next year looks much quieter on the housing market front, and I think calendar 2022 will be the start of a long slowdown in both price and rental growth, similar to what happened during much of the 1990s.
To keep up to date with my weekly thoughts on the Australian housing market, visit matusik.com.au.
Michael Matusik
Director, Matusik Property Insights